Inventory to Turnover Ratio (ITTR)
At Libero we believe Inventory to Turnover Ratio (ITTR) is the most powerful metric when it comes to measuring inventory as it enables comparison of inventory levels relative to turnover over time. To only measure total inventory value is, in our experience, pretty meaningless – without knowing how turnover has moved it is impossible to ascertain whether increases or decreases in inventory are proportional to changes in turnover.
We firmly believe that all businesses should be looking to reduce their ITTR year on year. Every business wants to see YoY growth in turnover and margin, so why would they not want to reduce ITTR? We have worked with many businesses that had a broad desire to “reduce inventory”, however these businesses proceeded without first assessing their historic inventory levels in relation to turnover, which just led to a directionless quest to hit an arbitrary inventory value.
Often reducing ITTR will mean that inventory can increase, in these situations it just needs to increase at a slower rate than turnover. Likewise, where turnover is decreasing, businesses may need to accelerate their rate of inventory reduction for ITTR to keep pace. The critical point here is that it’s the relative value of inventory compared to turnover that is critical.
Our Analysis
We have studied the historic ITTR levels of 746 manufacturers across the North West, North Wales and Shropshire. Collectively they generate £57.5BN in revenue (ranging from £1M to £4.1BN) and hold £7.2BN in inventory (ranging from £45K to £350M).
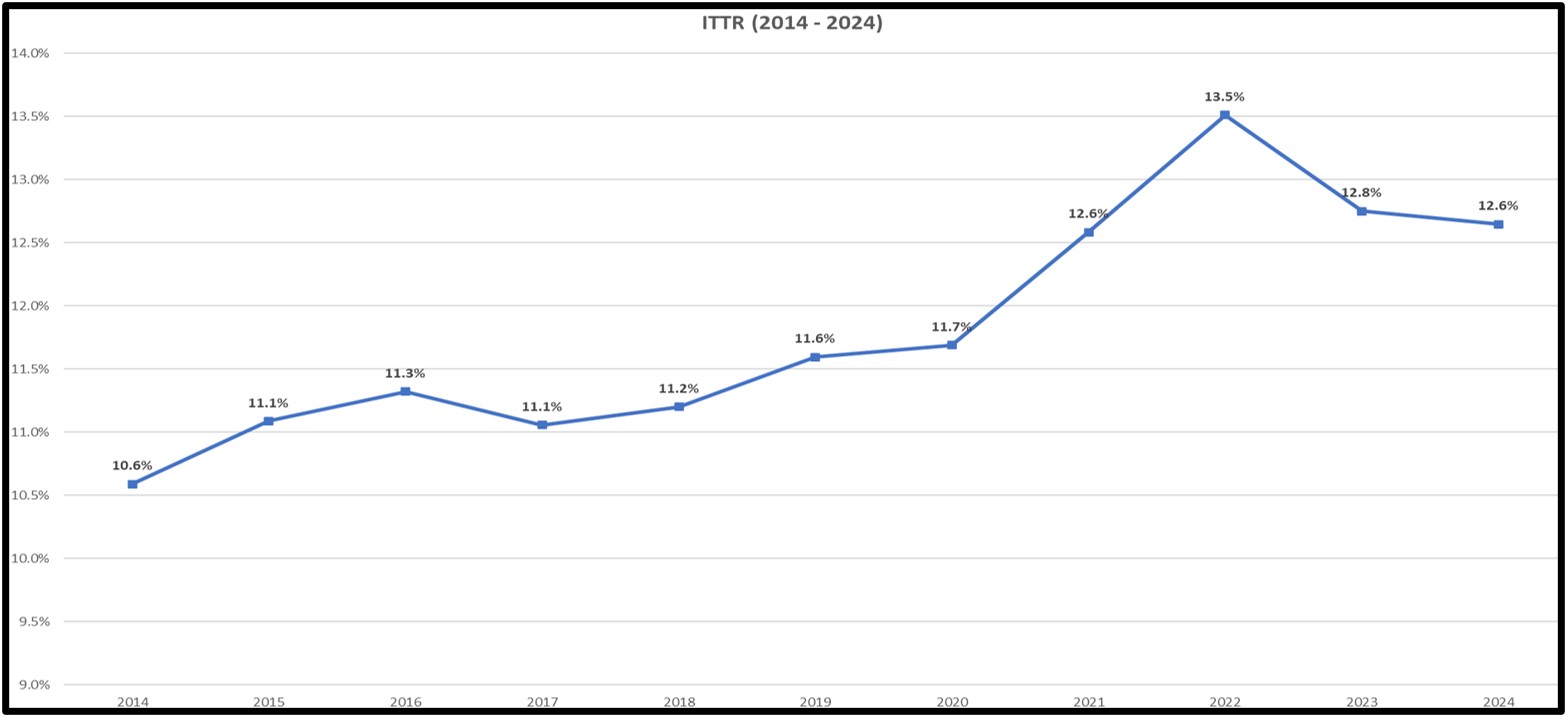
As the chart below shows, collective ITTR has been on the increase over the last decade:

ITTR was generally steady 2014-2020, fluctuating between 10.6% and 11.7%, before climbing to 12.6% in 2021 and finally peaking at 13.5% in 2022. While there was a fall back to 12.8% in 2023, levels are still well above 2014-2020. Early indications for 2024 do not suggest much improvement – with 144/746 sets of accounts published, ITTR currently stands at 12.6%.
It is very interesting to note that the reduction in ITTR between 2022 and 2023 has almost exclusively been driven by increasing turnover levels, rather than declining inventory levels:

£860 Million!
Average ITTR for the 7-year period 2014-2020 was 11.2%, meaning current levels are around 1.6% higher. If current ITTR had held around 11.2% collective inventory would be £6.4BN – however collective inventory is currently £7.2BN, meaning the 746 firms in our sample are collectively holding £860M more inventory than they should be!
Additionally, this is just to maintain parity with historic levels, without even thinking about improving on them. Assuming conservative holding costs of 25% this means our sample is spending £215M annually on carrying this additional inventory – that’s almost £300K per firm!
Headline Numbers
What can we learn from this analysis?
Of the 746 firms in our sample 70% have increasing ITTR – it is an issue impacting the majority of firms. If we only consider those firms with increasing ITTR, their collective inventory increase since 2014 is £1.8BN, at an annual holding cost of £457M.
These are huge numbers and suggest there is an endemic problem with inventory management in the UK which needs addressing.
Get in Touch
Libero are experts in reducing and optimising inventory in organisations of all sizes. If you would like support in reducing and optimising your inventory, to reduce holding costs and improve your cash position, GET IN TOUCH with us today!


