ITTR – A critical KPI
A couple of months ago we posted about how Inventory to Turnover Ratio (ITTR) has been on the rise. You can read the full blog post here, but to recap, we wrote about our study of 747 manufacturers across the Northwest, North Wales and Shropshire and how ITTR on the whole has been rising over the last decade.
At Libero, we believe ITTR is one of the most powerful inventory KPIs as it enables comparison of inventory levels relative to turnover over time. To simply measure your total inventory value is, in our experience, meaningless. Without knowing how turnover has moved it is impossible to ascertain whether increases or decreases in inventory are proportional to changes in turnover.
To compare both sets of figures in tandem is critical.
The importance of driving your ITTR down
ITTR is a KPI that should be trending downwards – a downward trend means a business is generating higher revenue per £1 of inventory. Put simply, decreasing ITTR means you are getting more bang for your buck, increasing ITTR results in diminishing returns.
What has our analysis shown?
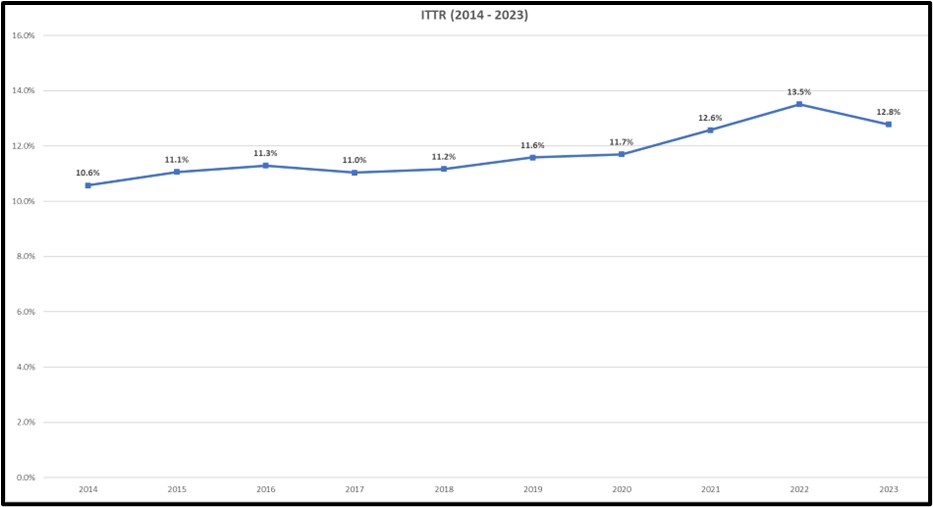
Our research showed that ITTR was generally steady 2014-2020, fluctuating between 10.6% and 11.7%, before climbing to 12.6% in 2021 and finally peaking at 13.5% in 2022. While there was a fall back to 12.8% in 2023, levels were still well above 2014-2020:

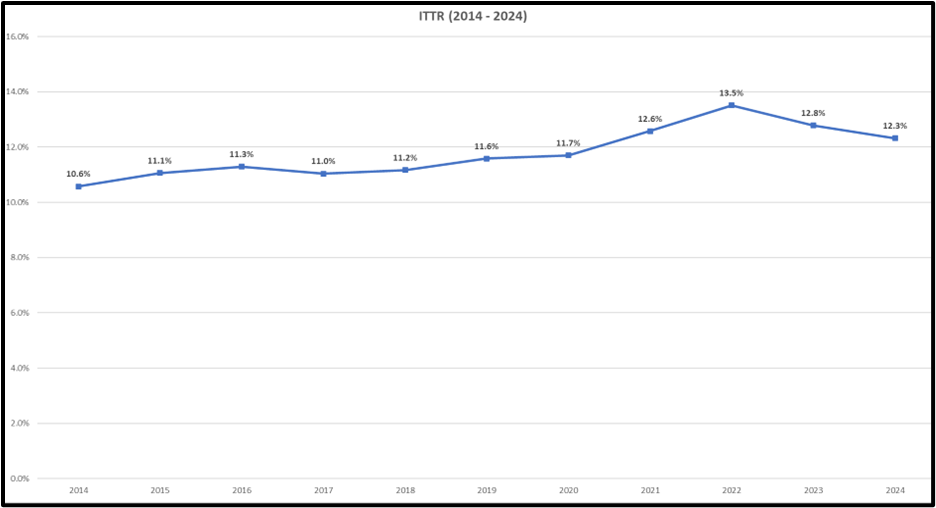
At the time of our last post, 144 firms in our sample had published their 2024 accounts, leaving 2024 ITTR standing at 12.6%. Since then, more firms have released their accounts, and based off the data for 317 firms (42% of our sample) we can see that 2024 ITTR currently stands at 12.3%:

On the face of it this appears to show further improvement. However, the data released to date is somewhat skewed by the profile of the firms who have released accounts – as the table below shows, based on average turnover, the data is skewed towards larger firms (larger companies are more likely to be public and must submit within 6 months, rather than 9 months):

The 17 very large firms in our sample with turnover of £500M+ exhibit an ITTR on 8-10%, whereas the 300 smaller firms in our sample with turnover of less than £20M exhibit ITTR of 16-17% – we believe as more small firms publish this is likely to drag the overall ITTR % back up and we expect 2024 to land broadly similar to the 12.6% seen in 2021.
What we can say for sure, based on the hard data for 2024, is that ITTR at 12.3% is running 1.1% above than the 2014-2020 average. While 1.1% might not sound much, across a sample of companies with £58BN turnover, 1.1% equates to an aggregate £637M extra inventory being held compared to 2014-2020.
Assuming 25% holding costs, which many would argue is conservative, this means our sample is burning £159M annually holding this additional inventory – this equates to 6.5% of their collective post-tax profits.
And that’s before we even start talking about the total level of holding costs, which we estimate to be £1.83BN. For context, our sample made £2.45BN post-tax profits, meaning inventory holding costs are equivalent to 74.7% of post-tax profits. Anything else that was costing businesses almost ¾ of their post-tax profits would be micromanaged to within an inch of its life, but most businesses appear to be letting inventory happen to them, rather than proactively getting it under control.
The Inflation Factor?
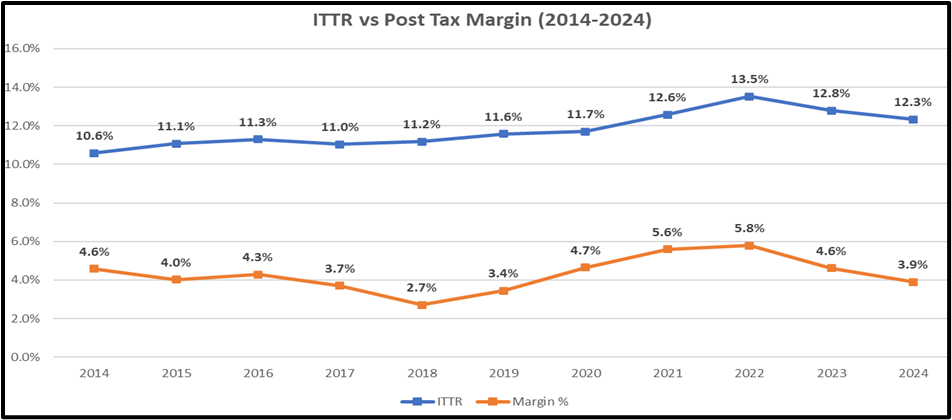
Now the businesses in our sample may argue that ITTR has increased due to inflation – after all if raw materials become more expensive to purchase, and finished goods become more expensive to produce, then inventory value is of course going to increase, and thus drive up ITTR… However the data doesn’t back this argument up. Margins are broadly correlated with ITTR, suggesting that increased input costs have been passed through to selling prices.

This leads us to the conclusion that the trend of increased ITTR is purely down to increasing inventory levels and has not been driven by inflationary pressures.
In Conclusion
Rising inventory levels and the trend of increasing ITTR is a pervasive problem – 69% of the firms analysed have increased their ITTR levels since 2014.
Just 11% of the firms analysed are currently experiencing their lowest ITTR level, whilst 15% of firms are currently experiencing their highest ITTR.
This perhaps follows a normal distribution – a similar proportion of firms are having their best year as are having their worst year, whilst the majority in the middle are having neither their worst nor best year.
Perhaps the most striking statistic, however, is that a staggering 89% of firms currently have ITTR levels that are higher than the best result they have posted over the last decade. In layman’s terms this means that 9 out of 10 firms have previously performed better than they are currently doing.
Inventory is like abdominal fat – very easy to gain but much harder to lose!!
Get in Touch
If you believe your inventory levels are too high, or you have the wrong mix of inventory, Libero are experts in helping organisations of all sizes reduce and optimise inventory. If you would like support in reducing and optimising your inventory, to reduce holding costs and improve your cash position, GET IN TOUCH with us today!


